 SundayHK
nginx-vts
编辑加入模块
git clone https://github.com/vozlt/nginx-module-vts.git./configure \
--prefix=/usr/local/openresty \
--user=www \
--group=www \
--with-file-aio \
--with-poll_module \
--with-http_realip_module \
--with-http_image_filter_module \
--with-http_gunzip_module \
--with-http_gzip_static_module \
--with-http_addition_module \
--with-http_sub_module \
--with-http_dav_module \
--with-http_flv_module \
--with-http_mp4_module \
--with-http_slice_module \
--with-http_random_index_module \
--with-http_secure_link_module \
--with-http_degradation_module \
--with-http_ssl_module \
--with-http_v2_module \
--with-http_stub_status_module \
--with-http_slice_module \
--with-http_geoip_module \
--with-http_auth_request_module \
--with-stream \
--with-stream_ssl_module \
--with-stream_ssl_preread_module \
--with-stream_realip_module \
--with-threads \
--with-pcre \
--with-compat \
--with-stream \
--with-stream_ssl_module \
--add-module=./nginx-module-vtsmake -j 8 && make install
http {
# ... 其他http配置
vhost_traffic_status_zone;
vhost_traffic_status_filter_by_host on; # If you want to filter by host
server {
listen 80;
server_name 192.168.1.200;
location /vts_status {
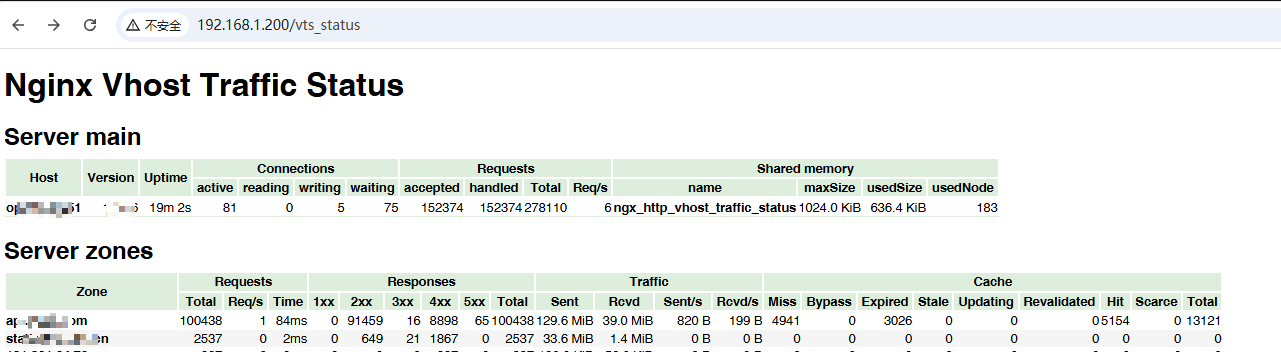
vhost_traffic_status_display;
vhost_traffic_status_display_format html; # 或者 prometheus, json
}
# ... 其他 server 和 location 配置
}
}http://192.168.1.200/vts_status
http://192.168.1.200/vts_status/format/prometheus
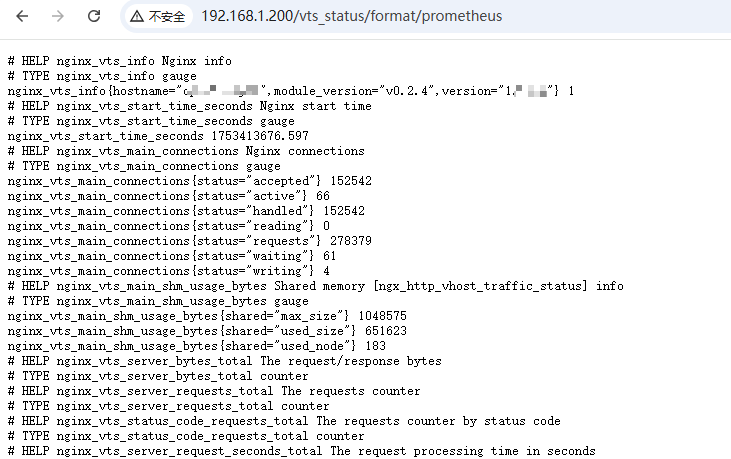
prometheus
# vim /opt/prometheus/prometheus.yml

  - job_name: 'nginx_vts'
    metrics_path: '/vts_status/format/prometheus'
    static_configs:
      - targets: ['192.168.1.200']
        labels:
          env: 'dev'
Grafana
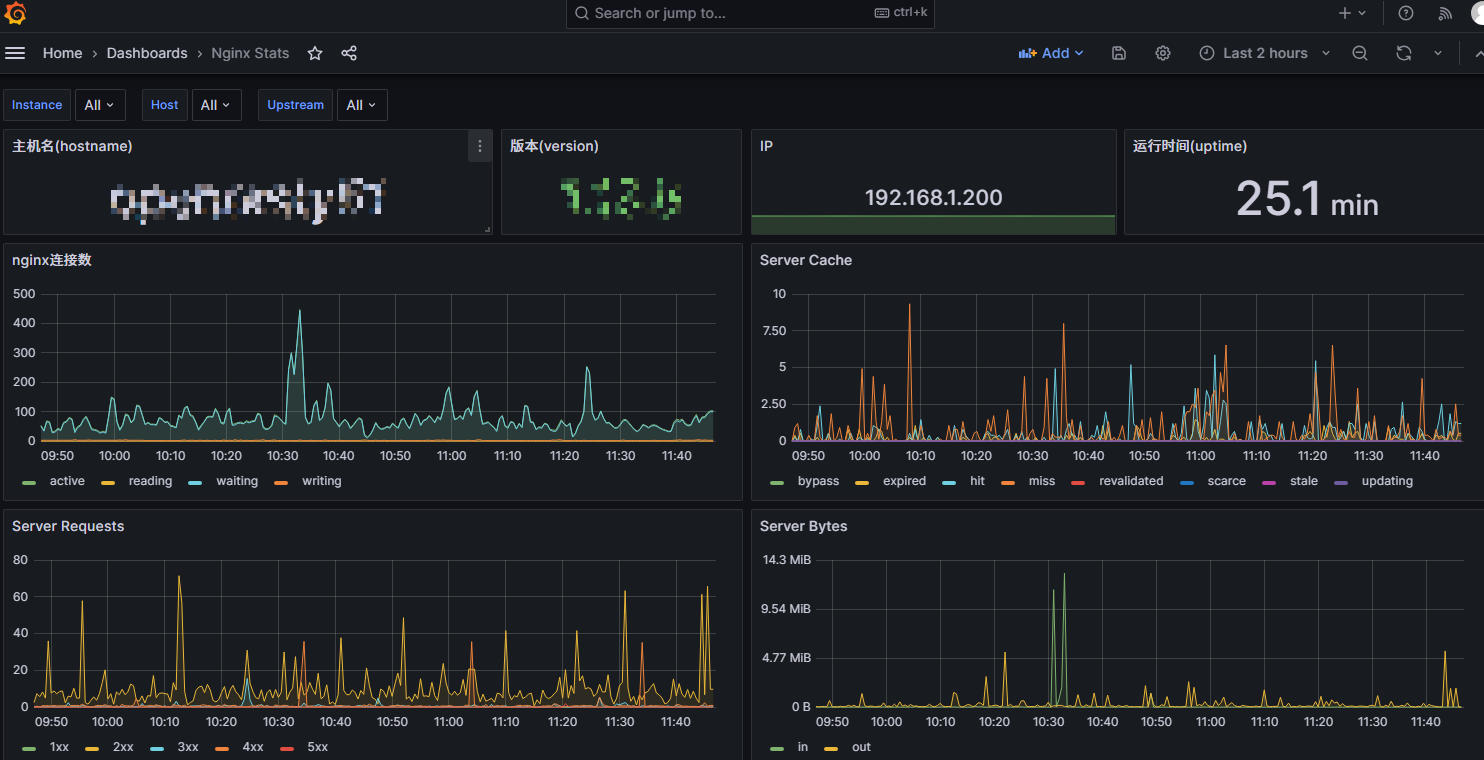
https://grafana.com/grafana/dashboards/15205-nginx-stats/
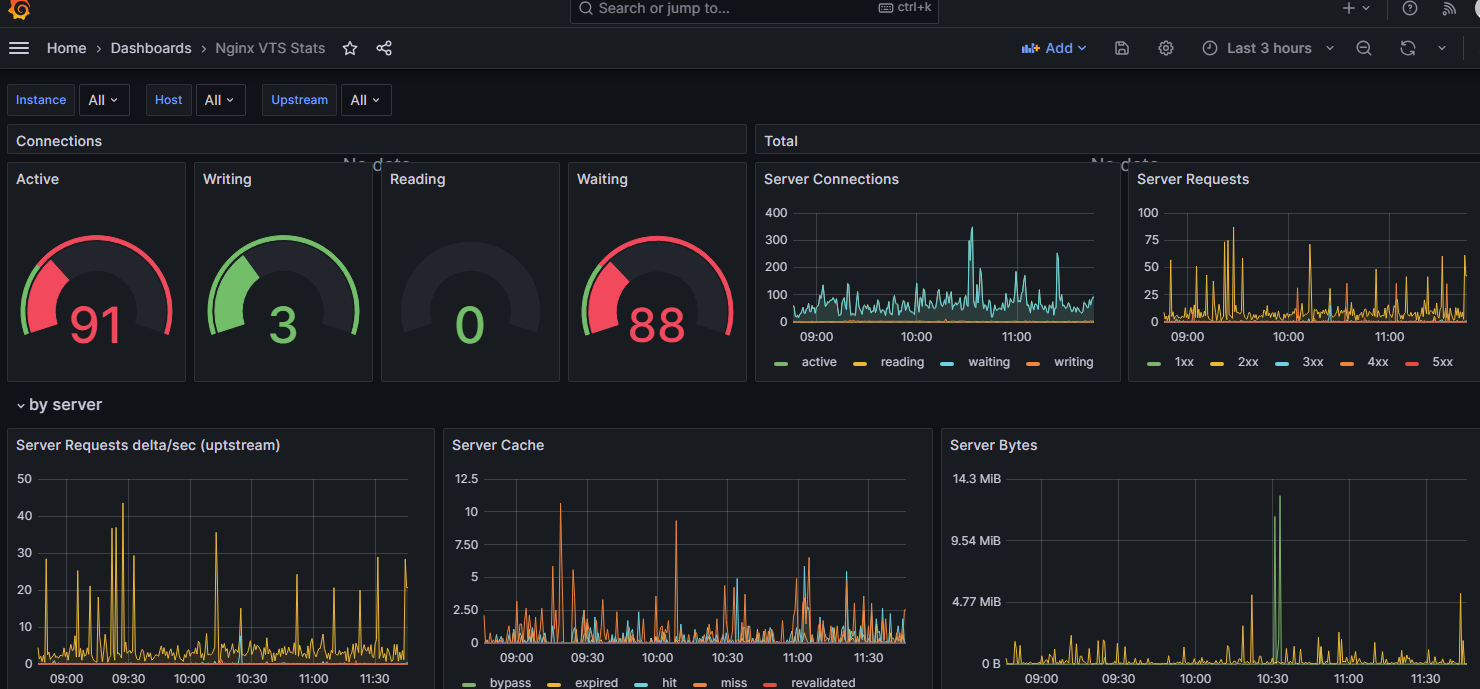
https://grafana.com/grafana/dashboards/14824-nginx-vts-stats/